

Abstract
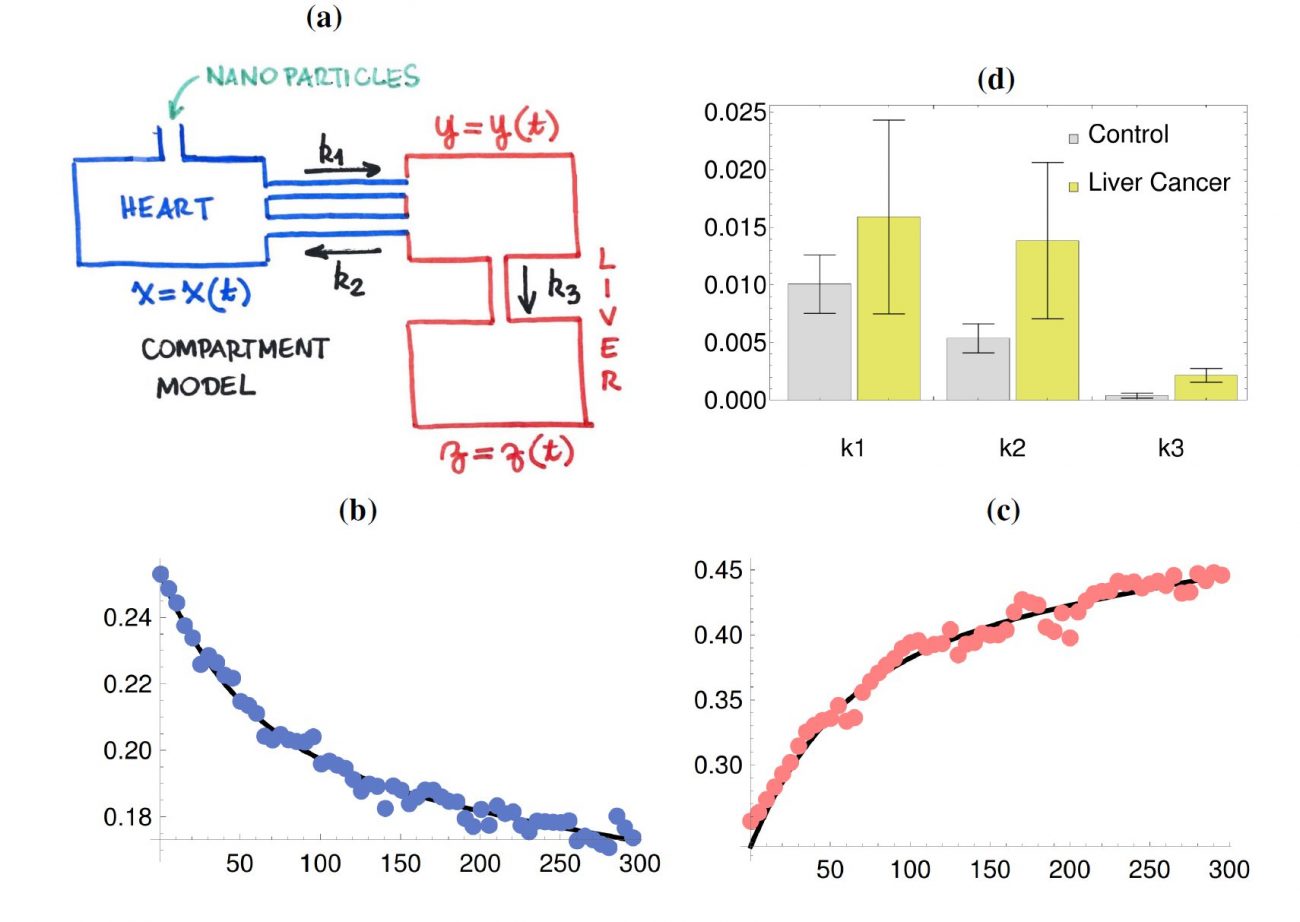
Through a mathematical modeling perspective, this study refers to the in vivo biodistribution of magnetic nanoparticles (MNPs) detected by multichannel alternating current biosusceptometry. In order to describe how the condition of hepatocellular carcinoma may change the biodistribution of MNPs, and aimed at translational research, two different groups of animals are addressed here: a control group (9 rats), and a group of individuals with hepatocellular carcinoma (8 rats). In a previous study, we report the details and discussions of the experimental results comprising these groups. However, these still lack a robust description in terms of mechanistic pharmacokinetic modeling. Accordingly, to describe the process of biodistribution of the referred MNPs, we propose the following ordinary differential equation model (see Figure 1a):
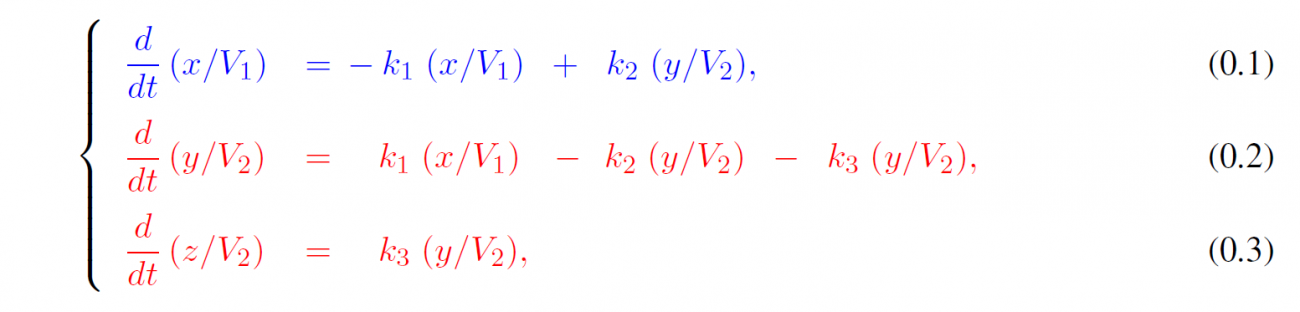 where x = x(t), y = y(t) and z(t) are the amounts of the magnetic nanoparticles (MNP) in each compartment. Regarding the parameters, k1, k2 and k3 are the transfer rates between the compartments and V1 and V2 are hypothetic volumes of biodistributions; V1 for the heart and V2 for the liver. To avoid identifiability issues, V1 is fixed at unity in the processes of parameter estimation using NLMEModeling [2]. By using the measured data for both x(t)/V1 and ( y(t) + z(t) )/V2 our goal is twofold: (1) to accurately describe the biodistribution of MNPs at the individual level and (2) to use such a description at the group level (i.e., simultaneously using data from many individual experiments) to access possible relevant changes in the distribution of MNPs caused by the hepatocellular carcinoma. These goals are shown to be achieved in Figures 1(b), 1(c) and 1(d), due to the suitable fittings and because only k2 and k3 are significantly different in the group with liver cancer. More results on the MNPs biodistribution will be presented at the conference.
Acknowledgments
DSR, JRAM, VAGL, ATB, and GAS thanks the funding received from FAPESP (Grants #2020/05556-0, #2021/06405-9, São Paulo Research Foundation). JRAM thanks CNPq and INCT-FNA.
References
[1] Soares, G. A. et al. (2022). Biodistribution Profile of Magnetic Nanoparticles in Cirrhosis-Associated Hepatocarcinogenesis in Rats by AC Biosusceptometry. Pharmaceutics 14(9), 1907. https://doi.org/10.3390/ pharmaceutics14091907 [2] Leander, J., Almquist J., Johnning, A., Larsson, J., Jirstrand, M. (2020). NLMEModeling: A Wolfram Mathematica Package for Nonlinear Mixed Effects Modeling of Dynamical Systems. arXiv https://arxiv.org/ abs/2011.06879