Joint Feedback Analysis Modeling of Nonesterified Fatty Acids in Obese Zucker Rats and Normal Sprague–Dawley Rats after Different Routes of Administration of Nicotinic Acid

S. Tapani, J. Almquist, J. Leander, C. Ahlström, L. A. Peletier, M. Jirstrand, J. Gabrielsson. Journal of Pharmaceutical Sciences, August, 2014, 103(8), 2571–2584.

Abstract

Data were pooled from several studies on nicotinic acid intervention of fatty acid turnover in normal Sprague Dawley and obese Zucker rats in order to perform a PKPD meta-analysis of data from more than 100 normal Sprague Dawley and obese Zucker rats, exposed to several administration routes and rates. To describe the difference in pharmacodynamic parameters between obese and normal rats, we modified a previously published nonlinear mixed effects model describing the tolerance and oscillatory rebound effect of nicotinic acid (NiAc) on non esterified fatty acids (NEFA) plasma concentrations.
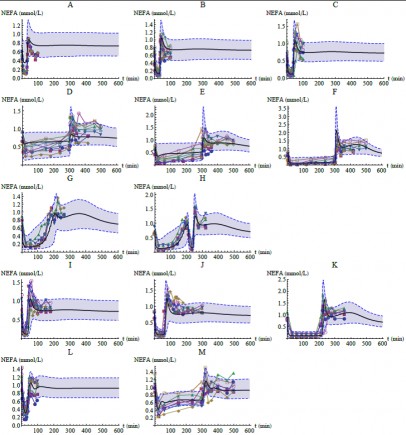
Observed NEFA plasma concentration-time profiles together with population model fits of NEFA plasma concentrations-time data for normal Sprague Dawley rats after infusion (A-H), oral administration (I-K), for obese Zucker rats after infusion (L-M).


We found that only three out of the seven parameters in the joint model are sufficient to be estimated separately when translating the NEFA dynamics from the obese population to the normal population. An important conclusion is that planning of experiments and dose scheduling cannot rely on pilot studies on normal animals alone. The obese rats have a much less pronounced concentration-response relationship and need much higher doses to exhibit desired response. The relative level of fatty acid rebound after cessation of NiAC administration was also quantified in the two rat populations. Building joint normal-disease models with scaling parameter(s) to characterize the “degree of disease” can be a very useful tool when designing informative experiments on diseased animals, particularly in the preclinical screen.
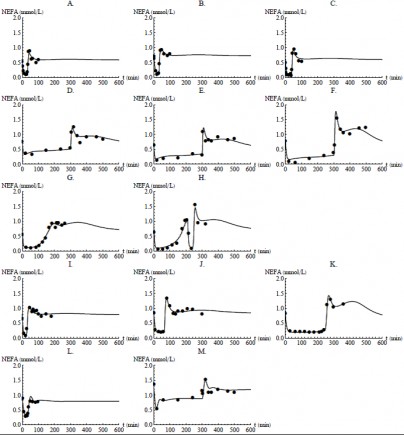
Representative individual model fits together with individual data of NEFA plasma concentration-time data for normal Sprague Dawley rats after infusion (A-H), oral administration (I-K), for obese Zucker rats after infusion (L-M).


The proposed joint model can serve as a pre-clinical tool to simulate drug- and disease-induced changes in NEFA. Data were analyzed using nonlinear mixed effects modeling in which, for the optimization, we used an improved method for calculating the gradient than the usually adopted finite difference approximation.

Authors and Affiliations

  • Sofia Tapani, Fraunhofer-Chalmers Centre, Sweden
  • Joachim Almquist, Fraunhofer-Chalmers Centre, Sweden
  • Jacob Leander, Fraunhofer-Chalmers Centre, Sweden
  • Christine Ahlström, AstraZeneca R&D Mölndal, Sweden
  • Lambertus A. Peletier, Leiden University, The Netherlands
  • Mats Jirstrand, Fraunhofer-Chalmers Centre, Sweden
  • Johan Gabrielsson, Swedish University of Agricultural Sciences, Sweden

The effect of degree of disease on extent and variability of rebound. The extent of rebound following the termination of a 300 min infusion was quantified as the maximum level of NEFA reached, expressed in percentage above the baseline. The population variability of this quantity was calculated for different degrees of disease (0, 20, 40, 60, 80, and 100 %, respectively) for three different doses (5, 10, and 51 µmol kg−1, respectively). Results are presented as box and whisker plots, showing the median values, 25% and 75% quantiles, respectively, and the minimum and maximum observations.


Photo credits: Nic McPhee