
Data Mining for Usage Patterns
The data available in today’s and future cars contain vast amounts of information and turning this into useful knowledge for decision support for product development of new and existing solutions in the car would provide a highly competitive edge. Volvo Cars has recognized this opportunity and launched the project Remote Data Collection and Visualization (RDCV), partly funded by VINNOVA’s FFI program.
The purpose of the project has been to study the whole chain from data collection in the vehicle to visualization and analysis in the office, where the focus has been on use cases regarding human machine interaction (HMI). An important part of the RDCV project has been to develop technology for data processing and visualization where FCC has analyzed and developed methods using tools from mathematical statistics, multivariate data analysis, classification and machine learning, regression, and clustering techniques.
The vision of the RDCV project has been that all units within project development shall have access to an anonymized tailored subset of field data to be included in their daily work process. To obtain this, tools and techniques to process and visualize big data resulting from remote data collection from Volvo cars has been investigated and developed. The knowledge mined from the processed data should eventually be used for:
- Decision support for product development of new and existing solutions in the car
- Detection of market trends
- Detection of characteristic operational modes of individual cars on an anonymized level
- Optimized non-critical system components, like media systems and HMI Interfaces
A prerequisite for allowing data collection from customer cars is to get customers’ consent to sharing data and also to actively select to what level data sharing is allowed. FCC’s part of the project has evolved around two themes: (i) quantification of distraction using HMI functions and (ii) detection of characteristic operational modes of individual cars on an anonymized level.
Quantification of Distraction
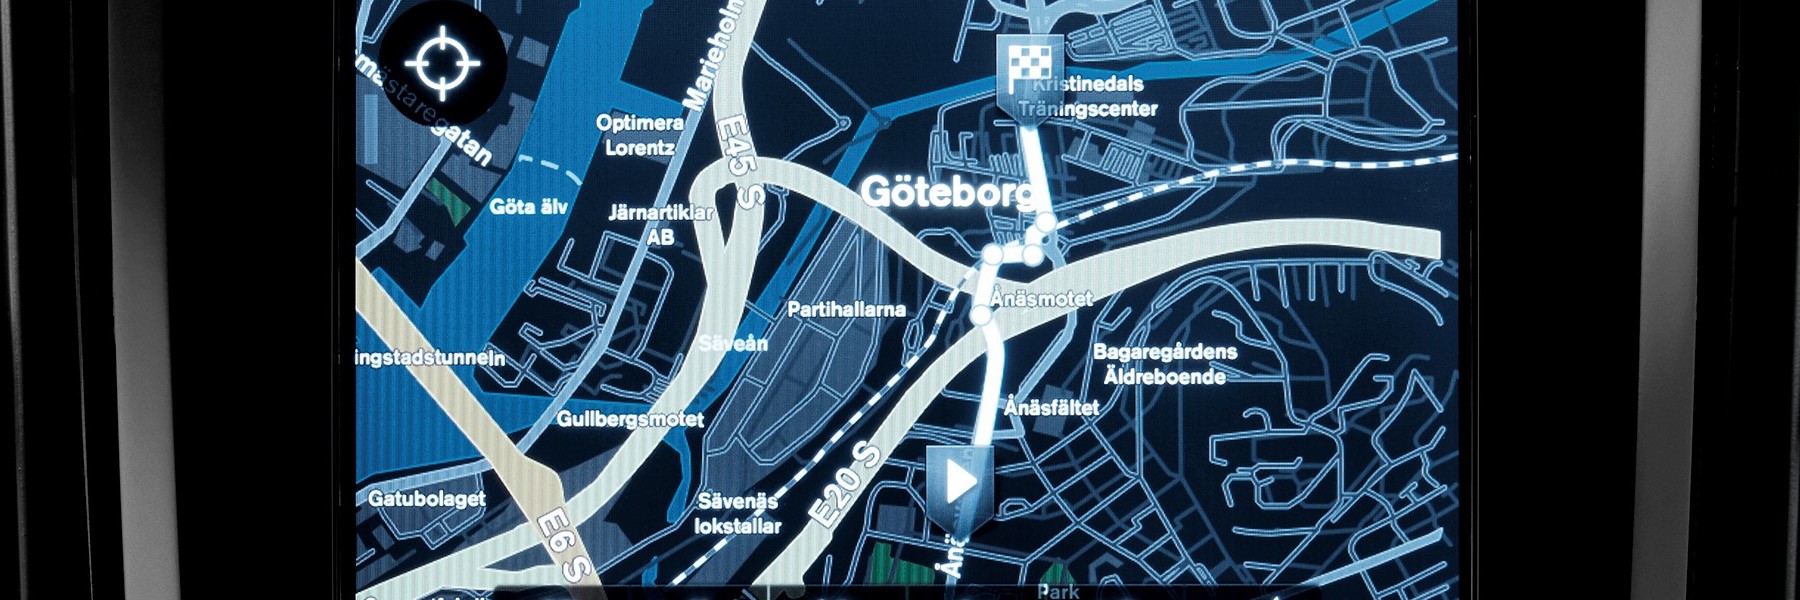
A thorough understanding of how the infotainment system in a car is actually used is of utmost importance to improve the driver’s experience. What functions are frequently used, how easily operated is the user interface, and under what driving modes or driving conditions are different functions used? One way to quantify how well the user interface is designed for simultaneous interaction and driving is to measure driver distraction for different functions such as dialing a telephone number, switching channel on the radio, or operating the navigator system. Distraction can be estimated by direct measurement on eye movements, and having the fraction of time when the eyes are not directed towards the road but on the user interface to be used as a measure of distraction. This requires extensive measurement equipment in the car including camera, so called eye-tracker system, and controlled conditions.
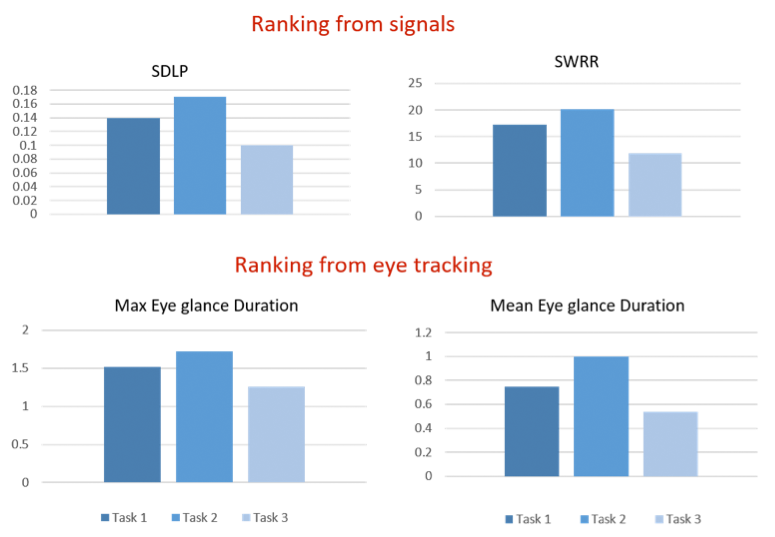
Evaluation of measure of distraction based on standard deviation lane position (SDLP) and steering wheel reversal rate (SWRR) compared to the measure of distraction based on an eye-tracker system. The bars show the ranking of three different tasks in terms of distraction for four different computed measures (task1: switch radio channel, task2: dial a phone number and hang-up, task3: maximize bass and treble of the equalizer).
In this project we investigated to what extent the information content in signals from the infotainment systems and other available signals in the car could be used to replace the eye-tracker system and controlled conditions constraints for quantification of distraction. If the level of distraction can be inferred from signals already available in the car, without any extra measurement equipment, it would facilitate direct feedback from actual use of different versions of the infotainment system from that part of the car fleet whose drivers actively have chosen to share this information. Examples of analyzed time resolved signals are lane position and steering wheel angle. The lane position standard deviation and steering wheel reversal rate were two candidates for measure of distraction. In a simulator study performed at Swedish National Road and Transport Research Institute (VTI) these two signals, as well as the corresponding eye-tracking measure, were used to rank the degree of distraction for a number of selected driving conditions and use cases of the infotainment system. The study showed that the ranking of the performed tasks with respect to distraction was preserved by computing measures of distraction, using signals already available in the car compared to distraction measured by an eye-tracker system.
Detection of Characteristic Operational Modes
Working with so called digital user experience (DUX) the understanding of the actual car usage and its context is of central importance. Traditionally, questionnaires, focus groups, interviews, and prior experience are used to investigate DUX related matters. Using signals available in regular cars, from drivers who have given their consent, cars can be categorized into different typical cases or driving modes and in this way one may deduce the actual usage of the cars. With this as a starting point the car can be better adapted to the anticipated needs of that typical case or driving mode. The adaptive design process can be implemented on different time scales, from direct adaptive user interfaces in the car that automatically change between driving modes such as highway driving and low speed/many turns trip segment to larger in between car generations design changes.
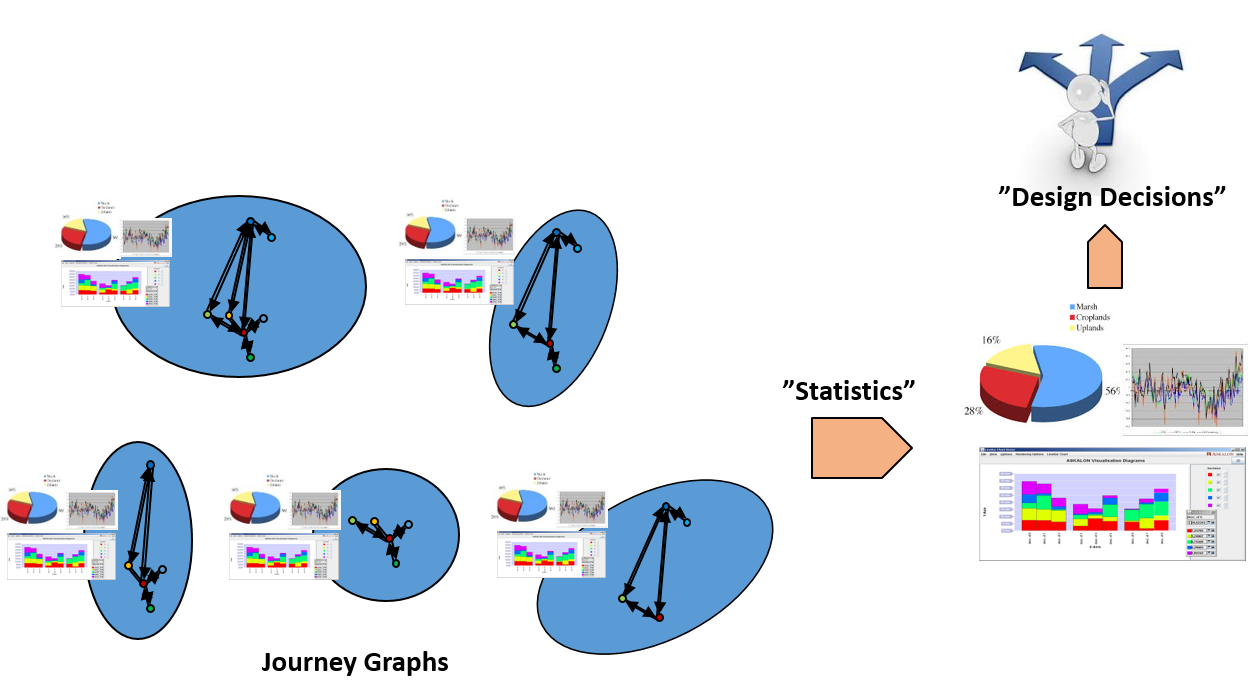
Statistical data analysis based on “Journey Graphs” for market quantification, evidence based engineering, predictive user interface, and value added sales.
In this project the term journey graph was coined, which can be used to quantify and visualize the set of different trip types a specific vehicle is involved in over time. In the project, data spanning several months from a selected set of daily used company cars were analyzed. Both hypothesis driven analysis and more explorative analysis were carried out. In the explorative data analysis different clustering methods and platforms for big data analytics were evaluated. The knowledge gained by the statistical data analysis and data mining approach of this project can be further explored for evidence based engineering, market quantification, predictive HMIs, etc.
Methods
The computational tools used and developed in this project belong to the fields of mathematical statistics and machine learning. Data of both categorical and time-series character has been analyzed using various statistical techniques ranging from simple mean and variance computations to more advanced ones such as feature extraction based on empirical histogram representations, similarity measures based on distance of distributions, and matching algorithms originally developed for DNA sequence similarity matching. An important aspect has been to apply machine learning techniques such as clustering and classification. Given the different tasks at hand, a range of different clustering approaches have been surveyed, see figure for an overview. More extensive work was spent on K-means clustering, the Markov Cluster Algorithm, and subspace clustering. The subspace clustering approach has found considerable interest in the data science community in recent years, and has been of particular interest in this project due to the high-dimensionality character of the available data.
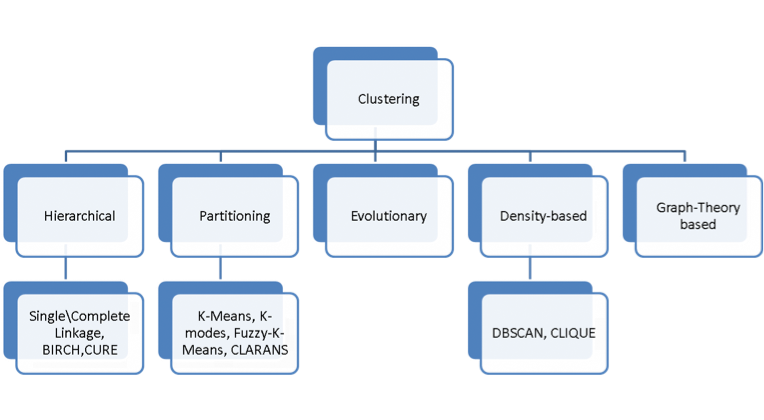
Overview Clustering Approaches
A particular aspect of the work has been to also address the streaming character of the data, i.e., that data is generated and accumulates over time. This calls for incremental approaches where algorithms not only work on static batches of data, but can be initialized by a previous analysis result and update such a result by only using the most recent data. Collecting and using personal driver data must be done in a way that protects the privacy of individual car owners. In this project privacy was addressed by investigating to which extent algorithms can handle mixed levels of data sharing from different users, e.g., by missing value approaches. The privacy aspect was also handled by looking into the concept of differential privacy and privacy preserving features.
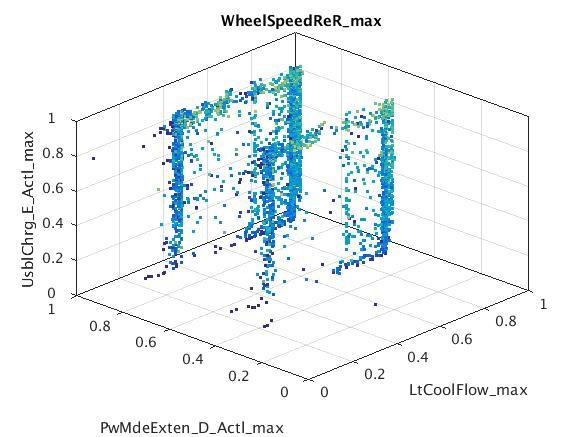
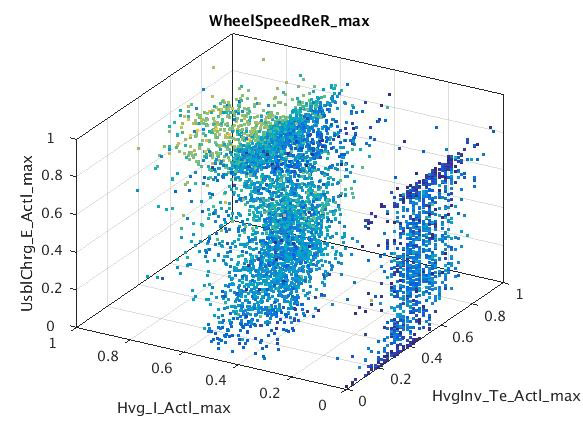
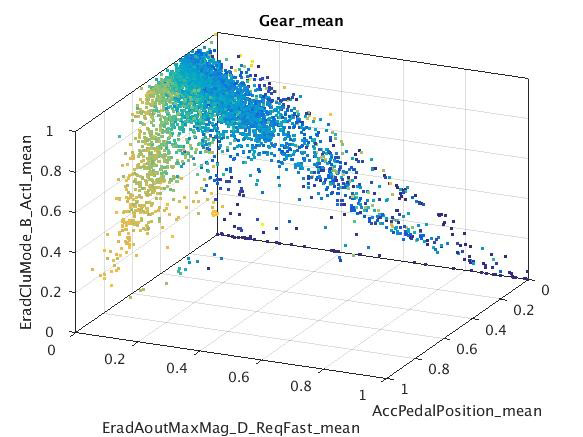
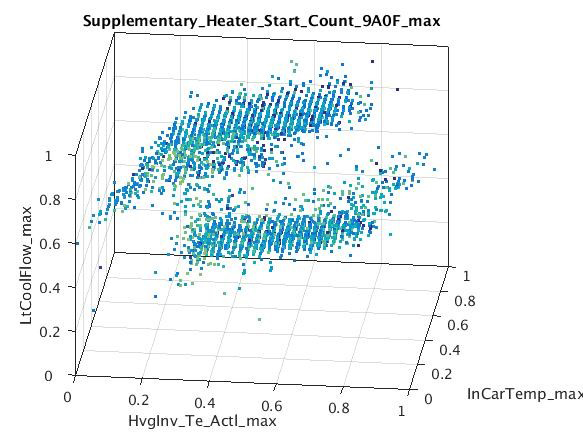
Examples of subspaces with clusters found using subspace clustering using all available signals in the sample data. Interpretation requires expert signal knowledge.
Results
The simulator study performed at VTI showed that for the included use cases distraction could be measured using signals available in the car without the use of advanced eye-tracking technology. With direct access to these signals and simultaneous logging of user interface operations with Volvo Cars it would be possible, in continued work involving test vehicles in regular traffic or ordinary vehicles operated by drivers who have given their consent, to quantify the level of distraction for different functions of the infotainment system. Through scale-up of the numbers of participants in studies of this kind, one can evaluate different versions of a user interface by comparing the level of distraction for drivers using the different versions (known as “A/B-testing” in statistics, which for example is used on a regular basis to evaluate web-based user interfaces). In the classification of car usage, the journey graphs of the test vehicles were identified and hypotheses about the vehicles usage were tested. The application of clustering methods from the field of machine learning was shown to give insights about different trip types and their characterization. Clustering on smaller sets of manually selected signal types and so called subspace clustering on a large set of signal types were employed. The project showed that explorative data analysis based on clustering and other techniques from machine learning have large potential and need to be employed with a big data perspective. Furthermore, the project identified a number of use cases for these methods such as:
- Market quantification Understanding and trends with respect to typical usage modes on different markets
- Evidence based engineering Measuring actual usage, identification of important or novel functionality, improving the design and development process
- Predictive user interface Identification of car usage mode and initialized trip type, automatic adaption of user interface