
Quantitative microscopy has in the last couple of years aroused substantial interest for life sciences applications. In eukaryotic cells, quantitative measurements of protein expression, protein localization and protein-protein interactions are key components for a proper understanding of cell functionality. FCC collaborates with several research institutions when developing algorithms and computer software for quantitative in vivo imaging. For the image analysis algorithms used, the emphasis lies on robust methodologies which enables long time-lapse studies of protein localization, migration, and inheritance over several cell cycles, as well as high through-put screening of protein functionality of a large number of gene-disrupted cells.
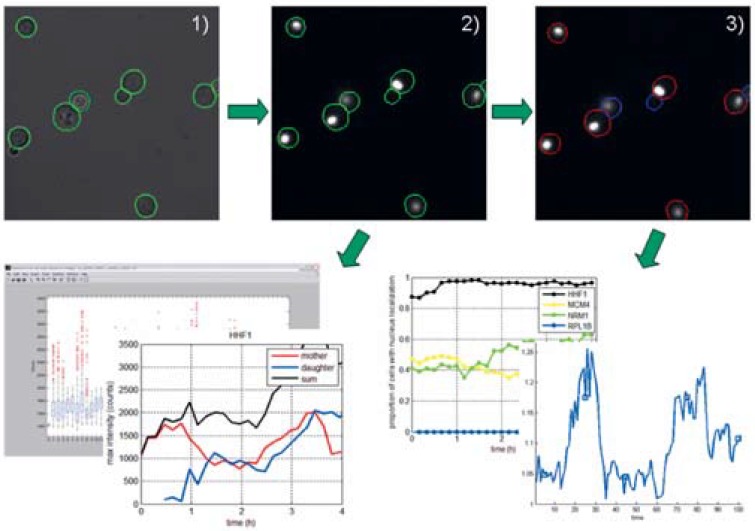
In microscopy studies carried out at the Bionanophotonics group at Chalmers (Prof Mikael Käll) together with the department of cell and microbiology at Gothenburg University (Prof Anders Blomberg) the objective has been to follow multiple individual cells over time to study the evolution of different phenomena and how this may vary over the cell population. An example of this is the dynamic response of individual cells to changing environmental conditions such as heat shock induced stress. In such cases the study of location (e.g. amount inside and outside of the cell nucleus) of specific proteins is a way to determine to what extent a cell is affected by the external stimuli. By tagging the protein of interest with a fluorescent marker the nucleus will become more or less fluorescent with respect to the rest of the cell depending on the amount of protein in the nucleus. This effect may be more or less pronounced in different individuals in an image of several cells so there is a need to quantify the response of each individual cell. Manual quantification is a very time consuming process which involves marking the areas in an image corresponding to the cell membrane and cell nucleus, counting pixels for each region and their intensities, and repeating this for the same cell in consecutive images to record how the amount of protein varies over time. This has to be done for every cell in the image and it is easy to conclude that doing this manually rapidly becomes a tremendous task, which is not possible with anything but a quite limited number of involved cells. Another disadvantage of manual analysis is that the result in many respects becomes qualitative and subjective as well as non-reproducible. With an automated quantitative method of analysis the result is reproducible and objective. It also enables more resource demanding analysis – e.g. measuring the distribution of a certain protein in a whole cell population over time.
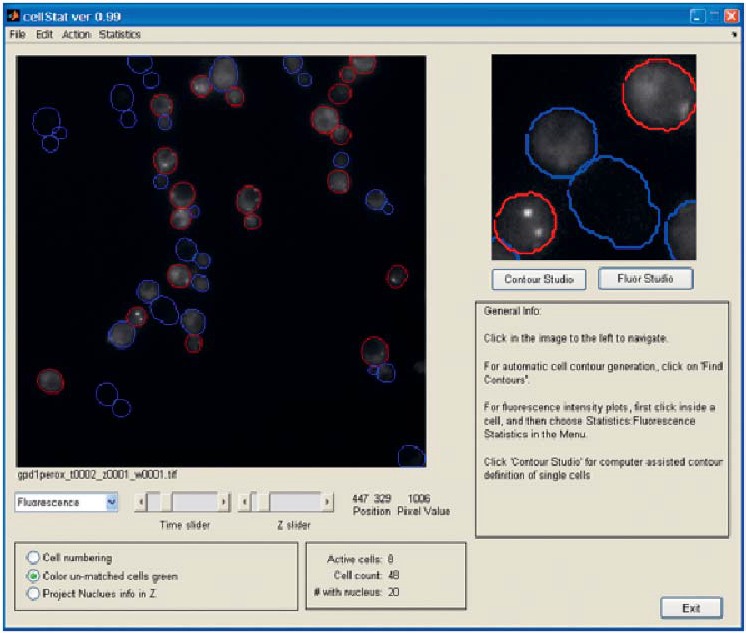
To automate the quantification of multiple single cell behaviors over time a project was conducted with FCC to develop algorithms and software tools for automated segmentation, tracking, and feature extraction on both single images and image sequences from time-lapse microscopy. The methods are implemented in a program entitled CellStat and applied in collaborative projects with external partners. CellStat is a tool equipped with graphical user-interface (GUI) for automated recognition and tracking of yeast cells from transmission microscope images, combined with quantification and localization of GFP-labeled proteins using fluorescence microscopy. The emphasis on the algorithms in CellStat lies on robust methodologies which enables long time-lapse studies of protein localization, migration, and inheritance over several cell cycles, as well as high through-put screening of protein functionality of a large number of gene-disrupted cells. One of the most recent studies involves tracking of 50-100 cells in image sequences consisting of up to 1800 images for several different cell cultures. For each single cell, the shuttling of tagged proteins between cell nucleus and cytoplasm is measured and from this data, conclusions on cell stress levels can be drawn. Single cell studies like these are crucial for proper understanding of cell functionality and an automated image analysis tool like CellStat is a key component in extracting data from microscopy. The development and use of the advanced image analysis algorithms in the software package CellStat has proven to be an indispensable tool in this interdisciplinary study conducted by a mixture of biologists, mathematicians, and physicists. CellStat can be used for free for non-commercial scientific purposes and currently three research laboratories use the software actively in their research. Technical facts CellStat:
- Contour recognition and tracking of yeast cells in microscopy image sequences.
- Core algorithms in C/C++.
- Interface in Matlab®.
- Free to use for research.
- Plugins for fluorescence data extraction, designed in collaboration with end-users.